In the drug response prediction dataset, the row indicates samples and the column represents genes. Thus, the number of features equals the number of genes. Unfortunately, the number of genes easily exceeds 10,000. This high dimensionality of the dataset requires a feature selection process to reduce dimensionality. There are several approaches to dimension reduction.
Differentially expressed genes
Comparing genes from sensitive and resistant groups reveals which genes look more different than others. Then, only highly different genes are selected for further analysis.
These selected genes are called ‘differentially expressed(DE) genes’. And they are fed into the machine learning model to train.
First, apply a t-test to get p-values of all features, then use FDR to filter out relatively less different genes (Reiner et al., 2003). Finally, apply the BW ratio to get the final set of genes (Dudoit et al., 2002).
- t-test
- FDR
- B/W
t-test and FDR 
BW ratio 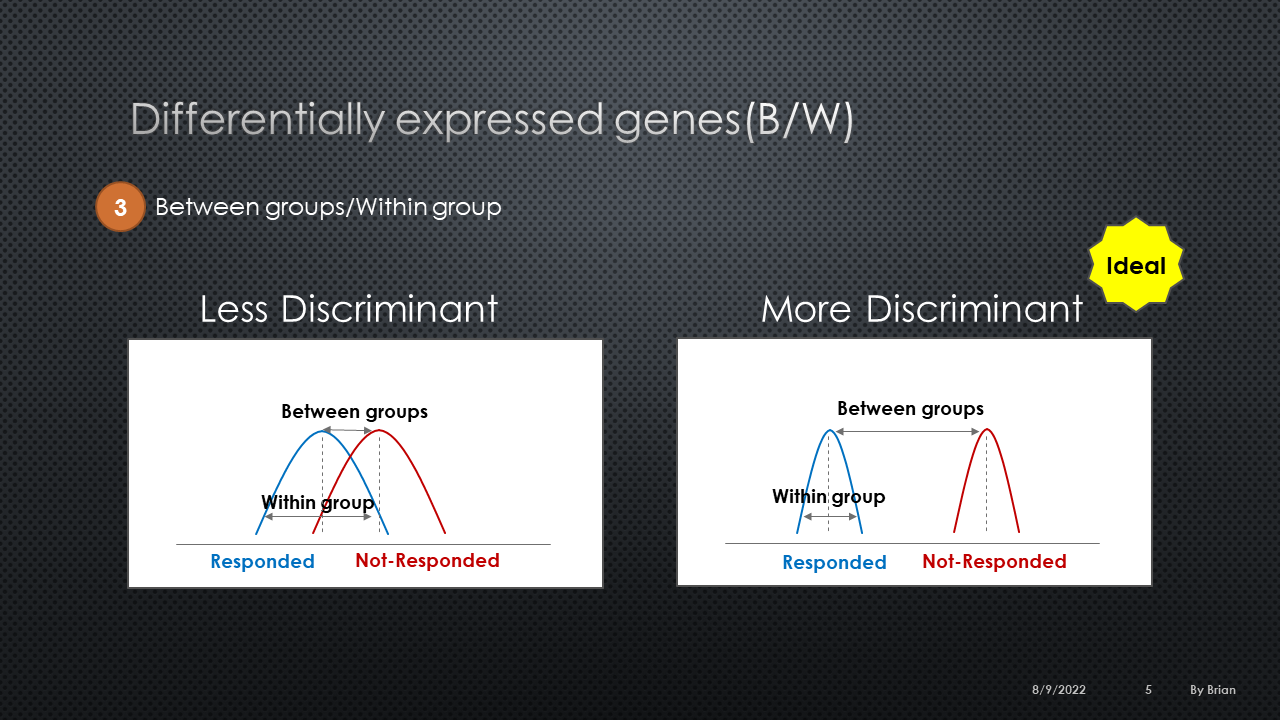
Domain adaptation (Mourragui et al., 2019) 
- Principal component analysis(PCA)
References
Dudoit, S., Fridlyand, J., & Speed, T. P. (2002). Comparison of Discrimination Methods for the Classification of Tumors Using Gene Expression Data. Journal of the American Statistical Association, 97(457), 77–87. https://doi.org/10.1198/016214502753479248
Mourragui, S., Loog, M., van de Wiel, M. A., Reinders, M. J. T., & Wessels, L. F. A. (2019). PRECISE: A domain adaptation approach to transfer predictors of drug response from pre-clinical models to tumors. Bioinformatics, 35(14), i510–i519. https://doi.org/10.1093/bioinformatics/btz372
Reiner, A., Yekutieli, D., & Benjamini, Y. (2003). Identifying differentially expressed genes using false discovery rate controlling procedures. Bioinformatics, 19(3), 368–375. https://doi.org/10.1093/bioinformatics/btf877